


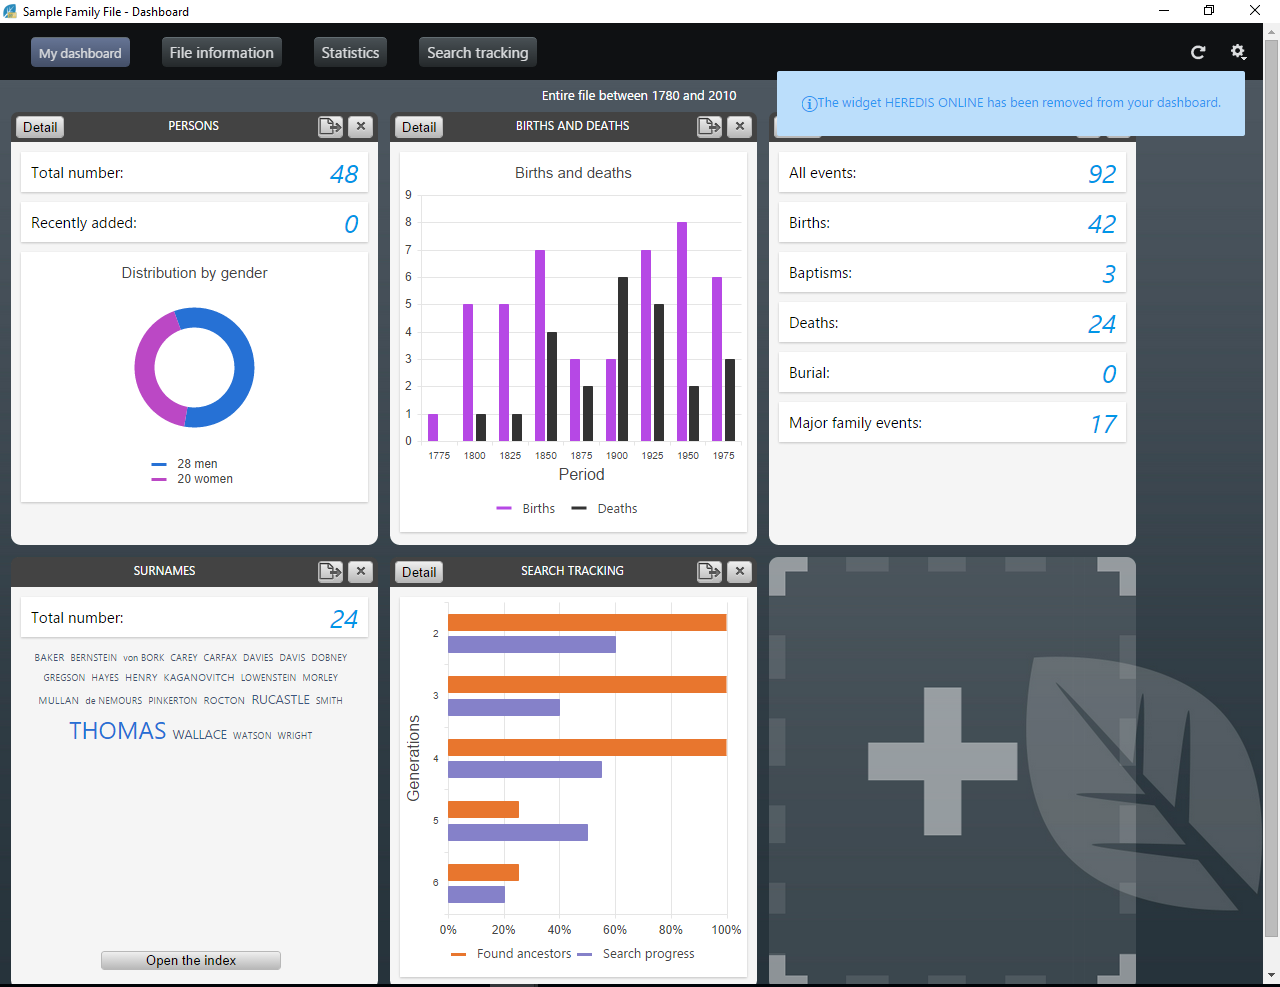
My dashboard
My dashboard https://help.heredis.com/wp-content/themes/corpus/images/empty/thumbnail.jpg 150 150 Heredis Help Knowledgebase https://help.heredis.com/wp-content/themes/corpus/images/empty/thumbnail.jpgThe Heredis dashboard is a tool that allows you to control your family tree on a daily basis. The different available indicators, whether quantitative or qualitative, give you a global vision of your genealogical data and also inform you about the progress of your work.
The dashboard can be accessed from the Tools > My Dashboard menu. You can also add the ![]() button to your toolbar if customized. (See Customize Heredis\Select the toolbar)
button to your toolbar if customized. (See Customize Heredis\Select the toolbar)
It consists of four tabs: My Dashboard, File Info, and Statistics in which Heredis displays indicators, also called widgets, presenting the current state of your family tree.
My Dashboard Tab
When you access the dashboard, it opens directly on the My Dashboard tab.
This tab is customizable, you can add widgets of your choice, delete those that do not interest you or reorganize them.
To add one or more widgets:
- Click the
 button.
 - Click on the widget you’re interested in
- Click add
My dashboard
The widgets are added after those already on your dashboard.
To remove a widget, click the ![]() button in the title of the widget. A notification informs you instantly that you have removed the widget from the tab. To see it again, just click the
button in the title of the widget. A notification informs you instantly that you have removed the widget from the tab. To see it again, just click the ![]() button to display the widget.
button to display the widget.
Note: You can also add or remove a widget from the other tabs of the dashboard. You can choose your favorite widget. Click on the grey star ![]() to add the widget. The star is now yellow
to add the widget. The star is now yellow ![]() , if you click again, it will be removed.
, if you click again, it will be removed.
To rearrange the widgets to suit you, click on the widget banner and without releasing the mouse, drag it to the desired location and then release the mouse.
Heredis automatically reorganize your dashboard space even if you resize the window.
If you wish to, you can display all widgets in the Dashboard tab.
The information displayed in the dashboard is by default your entire file, such as the title at the top of the page, as well as the data added today (see example, in the PERSONS widget, the indication «Recently Added»).
To change these options, click the cogwheel button ![]() at the top right of the page and select the filters that best fit your way of working:
at the top right of the page and select the filters that best fit your way of working:
• Filters showing recent additions: Today / Less than a week ago / There is less than one Month / Less than a year ago.
• Filters on persons: Entire file / Direct line ancestors/ Ancestry.
Then click on the Validate button, all widgets in the dashboard are updated based on the options you have chosen.
The widgets have a simple view and a detailed view. From the simple view, click the Detail button at the top left to display the detail view. From the detail view, to return to the simple mode, click the Back button on the top left.
Some widgets like NAMES or SOURCES do not have a detailed view. However, you can directly access their respective indexes by clicking the Open the index button. This allows you to easily find additional information.
Simple widgets
Simple view of the Source widget

Widgets in simple view display a limited amount of information. Their size is variable based on what you display. They feature a button ![]() to export the contents of the widget displayed in PDF or PNG format.
to export the contents of the widget displayed in PDF or PNG format.
Info • Note that as you hover over certain widgets, you have more accurate information. For the widget NAMES for example, when you pass the mouse over a surname, it immediately displays the number of times it has been used in your family tree.
Detailed widgets
Detailed view of the Person’s widget

The detailed version of a widget displays additional information about the current status of your family tree.
Each detailed version widget can be exported to PDF through the PDF button ![]() . You can then print or transmit it very easily.
. You can then print or transmit it very easily.
If you are working with a large screen or with two screens, you can keep the dashboard open constantly in order to control the progress of your family tree in real time.
When you add a data, click the refresh button ![]() to update your dashboard and have the latest information entered in your file.
to update your dashboard and have the latest information entered in your file.
File Information Tab
From this tab, you have an overview of persons, events, sources, places, surnames, given names, occupations, media of your file as well as your Heredis Online data. This general view allows you to know how far you are in your work.
To access this page from the dashboard, click the File Information button or select the menu Documents > File Information or, if you personalized your toolbar, click directly on the File Info button ![]() .
.
BIRTHDAYS
Starting with Heredis 2025, Heredis informs you of upcoming birthdays and today’s birthdays of persons assumed to be alive.
Note: Be sure to set consistency in Heredis’ Preferences for maximum males and females deaths. Do not exceed 120 years, otherwise you will no longer have any inconsistencies in the event of typos. See the article on Heredis’ Preferences in the paragraph on the Consistency tab.
If not already present in your toolbar, add the File Informations icon ![]() .
.
The icon changes its appearance and takes the shape of a cake ![]() when there are birthdays today. The number indicates the number of birthdays on the day, so it varies.
when there are birthdays today. The number indicates the number of birthdays on the day, so it varies.
Info: the icon refreshes every 4 hours if the file is open. So, if you modify a date to set today’s date as the date of birth of a person assumed to be alive, the icon won’t change until 4 hours later.
To access the Birthdays widget, click on the
- the File Informations icon
 or
or  in the toolbar
 - or on the Tools > File informations menu.
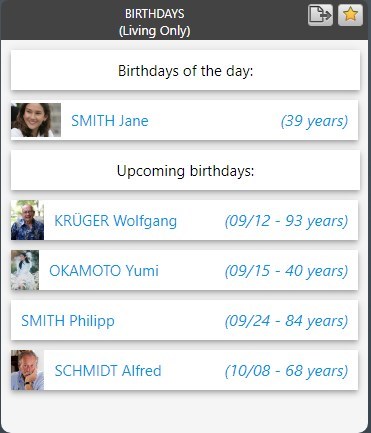
Click on a person’s name to navigate to the Family tab and view their information.
HEREDIS ONLINE Widget
To view the content of this widget, you must be logged in to your account. If you already have an account, click on Sign in ![]() button and enter your username and password otherwise, create one. (see the article “Heredis Online”)
button and enter your username and password otherwise, create one. (see the article “Heredis Online”)
Once connected to your account, this widget displays the date of the last publication of your file. You can access it directly by clicking the link “Visit Website”.
You can see it has been a while since the last publication? You can publish at any time from the dashboard by clicking the Publish button.
The detailed view shows you some new information. The first section shows you what you have recently be done on the open file: the last time you published it, the number of persons, of unions, of sources it contains.
All sections are foldable, just click on the title banner of the section to hide or display it.
For more details on Heredis Online, see Heredis Online and Publish with Heredis Online.
DEVELOPMENT OF MY FAMILY TREE widget
Simple view of Development of my family tree
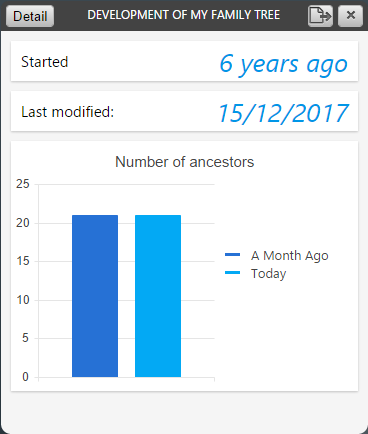
This widget shows you the evolution of your file in time:
– The date when you started your work, referring to the first person you created or imported in Heredis.
– The date of the last modification
– The number of ancestors (direct line) and persons found.
In the detailed view, a first chart shows the evolution of the number of ancestors and persons on a fixed time scale. The second chart shows the same data but on a variable time scale based on the date of the establishment of the persons in your file.
You can also check in this view 2 lists of persons, the list of the 10 last persons you added, and the one of the 10 last persons modified.
By clicking on these persons, you navigate on them in the Immediate Family.
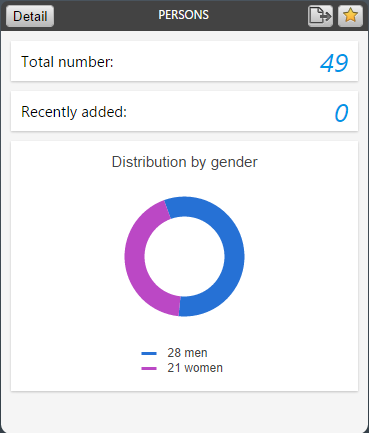
PERSONS widget
This widget shows the total number of persons in your file and those added recently.
In the simple display, a graph shows the distribution of persons by gender.
Simple view of the Persons’ widget
By entering the detailed mode, you can access:
- The «Progress» chart, which informs you about the quality of your family tree and in particular on the percentage of complete persons.
“3” is for the persons with the 3 main events completed, meaning you found the birth, marriage and death dates.
“2” is for persons with only 2 main events completed
“1” is for the persons for whom you completed 1 main event
“0” is for the person for whom you have not found any event
The notion of complete is directly related to Heredis’ preferences. From the menu Heredis>Preferences> Appearance, define what a complete event is for you. Heredis will then take these parameters into the «Progress» chart to determine if an event is complete or not.
- To the general information that will allow you to easily answer questions on your family history: who is the oldest person or the youngest among your comtemporaries? Who had the longest or shortest life? Who was the youngest or the oldest when they got married? Which couple had the largest family…
Every section is foldable, just click on the title banner of the section to hide or display it.
EVENTS widget
Simple view of Event’s
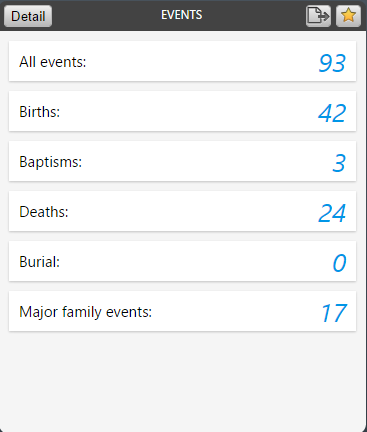
The simple version displays the total number of events, the total number of major events and the total number of family events.
The detailed version offers a zoom on the major events and displays in addition to the total number, the oldest event and the most recent event. For each event you can browse the person concerned with a single click.
SOURCES widget
The Simple Source Widget presents, in addition to the total number of sources and those recently added, a ring graph that allows you to analyze the quality of your sources.
Simple view of Sources’ widget
In this graph, we distinguish sources without media nor note, sources having only a note, sources with only media, and sources with a note and media.
To access the list of all your sources, click the button Open the index.
PLACES Widget
In this widgets, the frequency is shown by a word cloud. In this type of representation, the most commonly used places, for example, are displayed with a font size which varies according to the number of uses. When hovering with the mouse, an info bubble indicates the number of uses.
Places widget
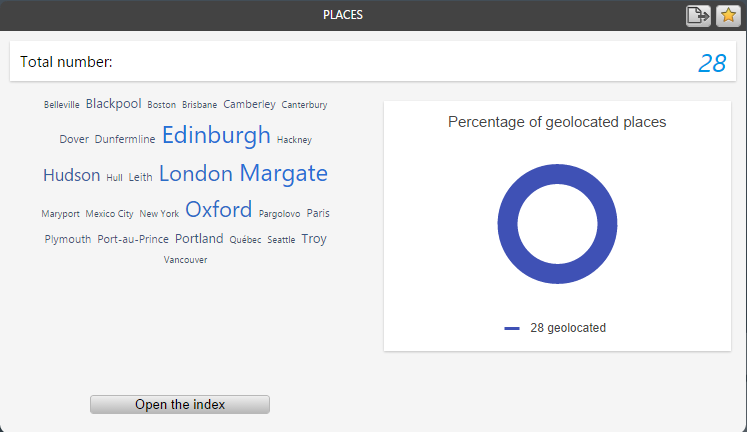
If you click on a place, Heredis opens the Index with this selected place and displays all information on it.
The Place widget also indicates the total number of places in your file and the places that were not geolocated (places without latitude and longitude information).
You can directly access the dictionaries by clicking on the button Open the index.
NAMES, GIVEN NAMES, OCCUPATIONS and MEDIA widgets
These widgets indicate the frequency of given names and occupations, as well as the number of uses in the genealogy file.
Names, Given names and Occupations’ widget
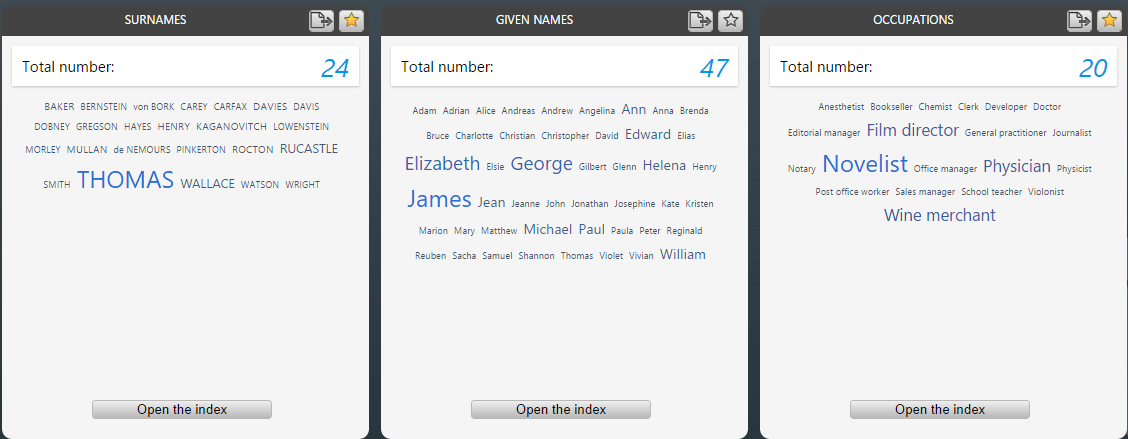
For the Names, Given Names, and Occupations widget, the frequency is represented by a word cloud, just like for Places.
The Media widget is a ring-shaped chart indicating used and unused media. For all of these widgets, you can directly access the indexes by clicking on the Open the index button.
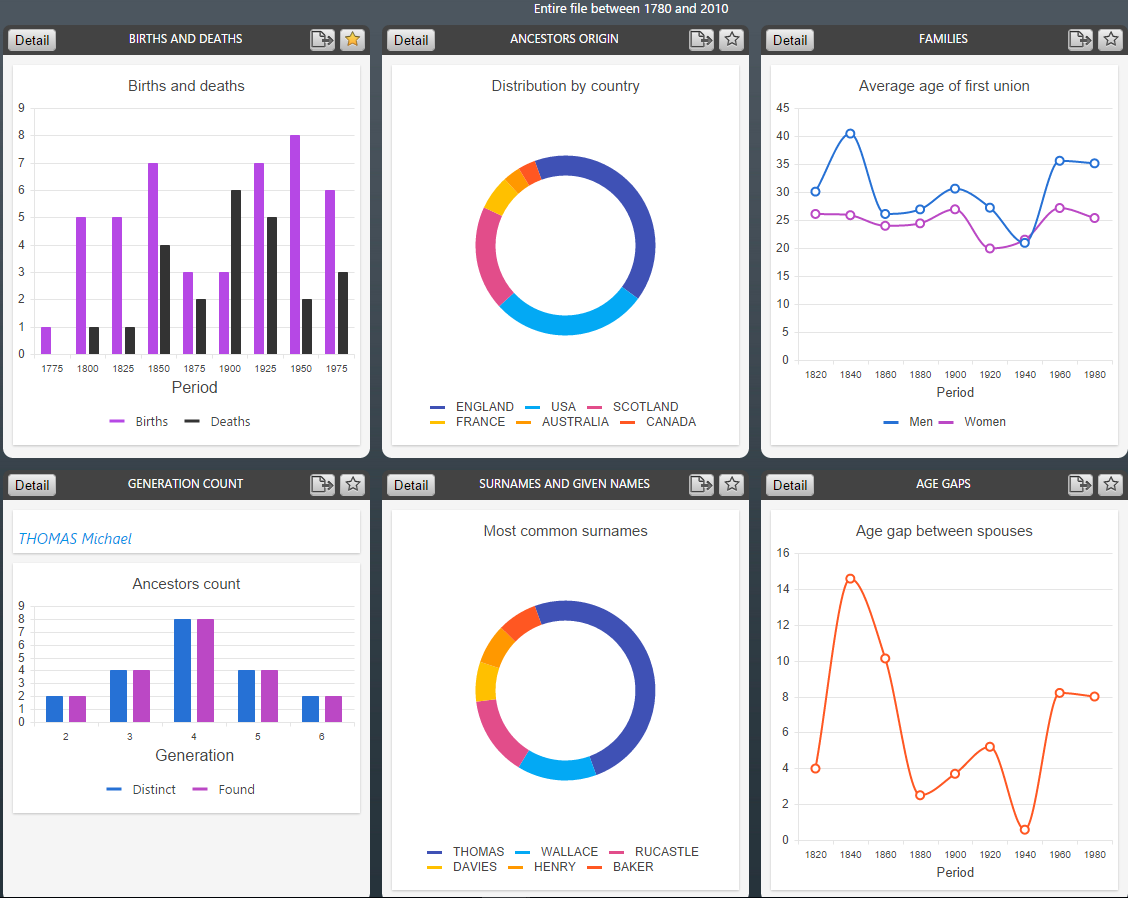
Statistics tab
In this tab, Heredis offers various genealogical and demographic analysis.
Statistics’ tab
To access this function, from the dashboard, click the Statistics button or select the Documents > Statistics menu or click on the statistics button ![]() directly from the toolbar, if you personalized it.
directly from the toolbar, if you personalized it.
The different analysis available are grouped into several widgets, Births and Deaths, Surnames and Given names, Families and Generation count…
In the simple version, these widgets present a simplified graph on births / deaths, the most common surnames, the average age at the first union and the ancestors count of the root person or the central person of your file.
You can easily export each chart displayed in PDF or PNG format by clicking on button ![]() located in the title bar, to share it or document your genealogical work.
located in the title bar, to share it or document your genealogical work.
In the detailed version, each widget gathers different analyzes and displays the graphs and data tables associated with them.
In order to use this data outside Heredis you can:
• export all the charts and data tables of the widget by clicking on the button ![]() , located in the title bar of the widget. Heredis displays an overview of the widget you can save to PDF.
, located in the title bar of the widget. Heredis displays an overview of the widget you can save to PDF.
• export a specific data table by clicking Details then on the button ![]() in the title bar of the data table. Heredis suggests that you save this data in Excel format on your computer. You can then analyze them using your spreadsheet.
in the title bar of the data table. Heredis suggests that you save this data in Excel format on your computer. You can then analyze them using your spreadsheet.
BIRTHS and DEATHS widget
Births and Deaths’ widget

This widget contains the following analyses: distribution of births and deaths, life span and census.
You can choose between one display per period with different possible intervals or one display by month according to what you want to highlight from your analysis.
In the Census widget, Heredis displays the number of persons who have lived in each period, based on their main events of birth and death on the one hand and the maximum age at death of the general preferences of Heredis on the other.
ANCESTORS ORIGIN widget
Ancestors Origin’s widget

This widget allows you to visualize the distribution by country, state/province, and county of the persons in your genealogy.
If you have selected Entire File as the Scope, the analysis will include every single person in your file. You can choose to narrow it down to the ancestors of the root person or of the primary person in your genealogy by setting the Scope to Direct-line Ancestors or Ancestors. To modify this option, click on the cogwheel in the upper right corner.
In the simple view widget, Heredis groups the persons according to their place of birth and displays a ring graph showing the most representative data by country, state/province or county.
If you click on the Detail button, Heredis will provide a full analysis by country, state/province and county along with a table indicating the number of persons found and the start/end years for the Period of appearance.
AGE GAPS widget
Age Gaps’ widget
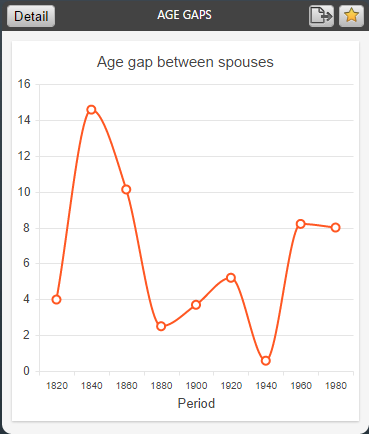
This statistical analysis focuses on the age difference between spouses and on the age gap between siblings in your genealogy. Just like in the previous widget, the scope of persons included in this analysis is set by you in the General Options of the dashboard.
In Simple view, Heredis displays a line chart showing the average age difference between spouses.
In Detail view, this same line chart is displayed along with a table filled with matching data and with another chart showing the average age gap between the first and last born among siblings.
Note: These charts only include couples with a minimum of one union entered with a date (Marriage, Religious Marriage, or other type of official marriage) and marital unions with at least two children properly entered with a date of Birth or Christening.
The default analysis interval is set to 50 years but you are free to modify this interval if you wish to adjust the data displayed in the charts and tables.
SURNAMES and GIVEN NAMES widget
Surnames and given names’ widget

This widget provides you with a distribution of the most common surnames and given names of your genealogy that you can filter by gender.
On the graph, Heredis displays a selection of surnames, the most common given names and regroups all the others in the category «Other». For each surname / given name we specify on the graph, the number of holders and the percentage that it represents on the total names or given names of the file.
FAMILIES widget
Families’ widget
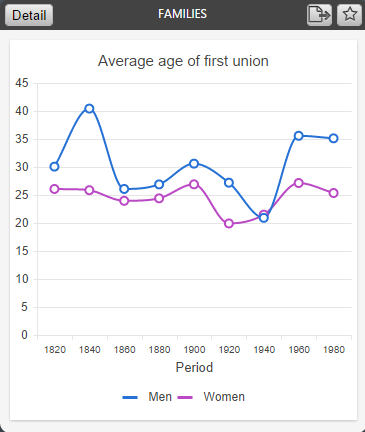
This widget contains the following analyses: average age at first union, number of children per family and the number of families.
You can choose between one display per period with different possible intervals or one display by month according to what you want to highlight from your analyses.
GENERATION COUNT widget
Generation Count widget

In this widget, Heredis offers to analyze the direct ancestors and descendants of root person of your file, if you selected «Entire File» or «Direct ancestor line» in the options of the dashboard, if not then the ascendants and descendants of the primary person if you selected «Ancestors».
The display, by generation, of the number of ancestors and descendants, found and distinct, makes it possible to highlight duplicate branches in your family tree.
What is a duplicate branch? Everyone, in their family tree, has a real number of ascendants that is lower than the theoretical number of ascendants because we descend several times from a same person because of marriages between more or less close cousins, we are then in the presence of a case of duplicate branches. Hence the importance of putting forward the distinct ancestors or descendants: when they are inferior to the found ancestors or descendants, it is because there is a duplicate branch.
Note: Changing the period and the analysis interval applies to all charts of the widget.
All events with a calculated date are excluded from statistical analysis.
