


(Mac) Unlimited size tree chart : ancestors, descendant and hourglass
(Mac) Unlimited size tree chart : ancestors, descendant and hourglass https://help.heredis.com/wp-content/themes/corpus/images/empty/thumbnail.jpg 150 150 Heredis Help Knowledgebase https://help.heredis.com/wp-content/themes/corpus/images/empty/thumbnail.jpgYou can create as many graphical representations of your genealogy as you wish. A tree chart may be saved with the data it contains and its layout. It can then be reopened, modified in its presentation, printed again. It has become independent of the Heredis data file.
Choose Documents > Charts… or click Charts ![]() on the toolbar to visually select the tree charts proposed by Heredis.
on the toolbar to visually select the tree charts proposed by Heredis.
The printing of a tree chart takes as its starting point the primary person displayed and will display his/her ancestors, descendants or both as an hourglass tree chart.
Choice of tree chart
Choose your tree chart and the theme

In the displayed selection screen, choose the type of tree to build from the list.
Heredis proposes various types of tree charts of unlimited size. Whatever the type of tree chart selected, you can print it or have it printed over several pages or a single long strip of paper.
When a tree exceeds the size of your printer, each page is printed with an overlap to facilitate mounting of the chart.
Choice of theme
Click a theme in the coverflow. To facilitate your choice, Heredis displays an overall preview of the tree to be edited with this theme and a preview of a box. Scroll through the different themes by pressing the arrow keys.
The last used themes are preset for each type of tree chart.

Chart Settings
Specify the construction parameters that suit you for the selected theme: number of generations, people to be displayed or not on the tree chart.
- Indicate the number of generations. It may go up to 99 for ancestors as well as descendants.
- On Ancestors tree charts, select Minimize Spacing for nesting boxes and rearranging space for the tree chart. If you do not tick this box, persons are drawn with respect to the axis of their parentage: those who are not direct relatives are never drawn one below the other.
- Select the persons for inclusion on the tree chart. By default all persons appearing in the ancestry or descent of the primary person are displayed on the tree chart. You may untick secondary persons, or marked and confidential persons, for them not to be displayed on the tree chart. You may also hide all the data you have declared to be private (events, pictures, etc.). See The different data fields article.

Tree Chart Screen
Heredis displays a tree chart representing the lineage of the primary person and which is printable immediately. If you want to make changes to the tree chart, you have tools in the form of removable panels specific to the various tree charts.
Toolbars and Menus
When the tree chart is displayed, the menus and buttons are different from those for data management.
Use the ![]() New –
New –![]() Open –
Open – ![]() Save –
Save – ![]() Page Setup –
Page Setup – ![]() Print buttons for normal actions.
Print buttons for normal actions.
Display the buttons you most often use by choosing right click on the toolbar then Customize toolbar.

Use the tree chart menus to manage also the layout of the screen or the selection of people on the tree chart.
Info • You can create a new tree chart while an existing tree chart is already on the screen. Click the ![]() New button on the chart toolbar and select a new type of tree chart and a new theme, or choose File > New.
New button on the chart toolbar and select a new type of tree chart and a new theme, or choose File > New.
Persons Panel
The Persons panel of the tree chart contains a list of all individuals included in the chart. Clicking a person in the list previews that person’s box in the tree chart. A double click navigates through the tree, if its size exceeds that of the screen, to display the box for a selected person.

To quickly find a person in the list of individuals on the tree chart, enter the surname and/or one or more given names. Refine the search by selecting from the pop-up menu, the gender of the person sought if the name is multiple.
When there are marriages between blood relations (implex) on your tree chart, certain ancestors may be included more than once. Heredis will only display one complete branch and duplicate branches are cut off. You may locate implex ancestors in the list because they are displayed in gray. Click the name in black to display the whole branch. Click the name in gray to display other locations of this ancestor on the tree chart. Their boxes have identical implex lettering.

Info • In the tree chart, click the implex lettering of the box to navigate to the other box of the implex ancestor.
The Data panel shows you a summary of the person whose box is selected. All information displayed here may appear in the box according to the type of content selected.
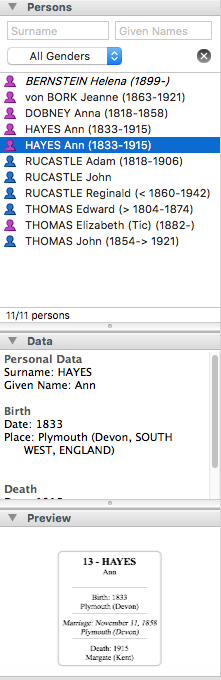
The Preview panel shows the selected box. At the opening of the tree chart, Heredis displays a complete view of the document, whatever its size. The preview is very useful in large tree charts, when the content of the boxes is not readable on the screen. This visualization immediately displays any changes that you apply to the box.
Settings Panels
You may modify the unlimited tree charts to give them a more personal graphical appearance.
These panels allow either changes to be applied to the whole tree chart or changes to a given selection (one or more boxes). Use the Select menu to choose the selected boxes or draw a rectangle around the boxes to be modified to select them.
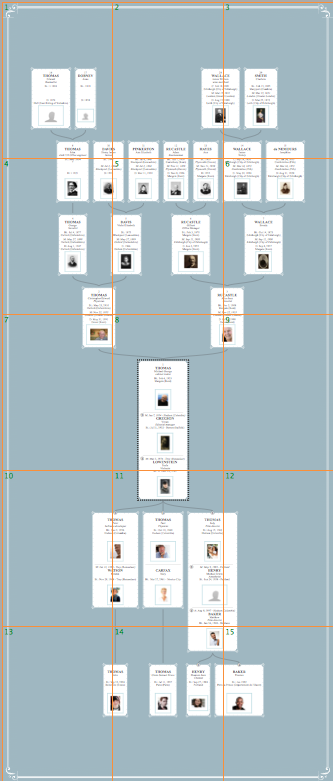
Display screen
The central area of the screen shows all the boxes of the tree chart, the background image and the frame of the tree chart.
To help you check and estimate the size of your tree chart, materialize the pages on the screen.
Unfold the Print Setup panel and select Show Page Breaks or choose View > Show Page Breaks.
The number of pages depends on the chosen page format for your printer. To change the format and page orientation in your printer, click the Page Setup button or choose Page Setup ![]() .
.

To move around the tree chart, use the horizontal and vertical bars, or change the zoom factor or double-click the name of a person from the Persons panel to display his/her box directly.
Zoom
You can increase (zoom in) or reduce (zoom out) the display of the tree chart. It is often necessary to reduce the display of a tree chart to visualize all required generations.
Choose View > Zoom > Increase Magnification or View > Zoom > Decrease Magnification. To return to the actual size of the tree, choose View > Zoom > Actual Size.
You may also select different levels of zoom on the bottom bar of the tree chart screen.
- Select a value from the pop-up menu or use the slider to change the zoom level. Heredis indicates the factor used to reduce or enlarge to the right of the cursor.
- Click the 100% button to return to the real size of the tree.
- Hold down the Option (
 ) key and the cursor takes the form of a magnifying glass. With a left click, the tree chart grows, with a right click, the tree chart is reduced. You may also drag the mouse around a group of boxes to increase their size or use the mouse wheel up or down to enlarge or reduce.
![]()
Info • Remember to display the tree chart in full screen mode to have as much room as possible: click the Full Screen icon (green) on the screen bar of the tree chart.
Selection
Before making changes to a tree chart, first select the boxes to which they will apply. Depending on the type of change to be made, make individual selections or selections of a genealogical order.
- To select all boxes of the tree chart, choose Select > Select All. From anywhere in the tree chart, you can right-click the mouse and choose Select All.
- To select one or more boxes of the tree chart, drag the mouse cursor over the boxes to be selected.
- To select more boxes that are not contiguous, select the first box, and then, holding down the Command (
 ) key, the additional box or boxes.
 - To make genealogical selections from any box in the tree, right-click the mouse and choose Select Men Only (or Women Only, or Person and All Ancestors, or Person and All Descendants or Generation).
Info • Persons corresponding to the selected boxes are also selected in the Persons panel.
Format the tree chart
To make changes, display the tree chart panel column and unfold the Whole Chart and Selected Items panel by clicking the disclosure triangle.
Select the boxes you want to change.
Change the layout of the tree
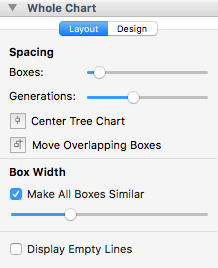
- Click the Layout tab on the Whole Chart panel.
- Change the space between the boxes or the spacing between generations by using the sliders.
- Tick the Display Empty Lines box for all boxes to be filled with the same number of lines, even if you do not have information.
- Click the Center Tree Chart button to reposition it optimally after modifications.
- Click Move Overlapping Boxes to reconstruct the tree chart, preventing boxes from straddling over two pages. The tree chart layout is thus facilitated since only connecting lines between the boxes require adjustment.
- Change, if necessary, the width of all boxes of the tree chart with the cursor. If the selected theme contains boxes of varying sizes, to suit to the data contained, select Make All Boxes Similar and specify the desired width with the cursor.
Move elements in the tree chart
After selecting boxes, several methods for moving them are available. Choose the one that suits you best.
- Mouse: Drag the selection to its destination by holding the mouse button pressed.
Info • Hold down the Shift key to prevent any movement off the generation axis. Each box moved will remain aligned with the other boxes in the same generation.
- Arrow keys: press the arrow keys to move to the position you wish to select.
To cancel the moving of the selection, press Command ( ![]() )-Z or choose Edit > Undo.
)-Z or choose Edit > Undo.
To restore the move, press Shift-Command ( ![]() )-Z or choose Edit > Redo.
)-Z or choose Edit > Redo.
Change the design of the tree chart
Change the graphical appearance of your tree charts with a few clicks. Some graphical changes apply to the whole tree chart, others apply only to the boxes you selected.
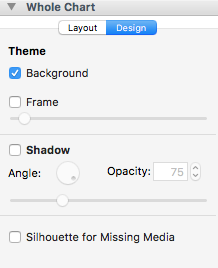
- Click the Design tab in the Whole Chart panel.
- Display the frame of the tree as well as the background pattern by clicking the Frame and Background tick boxes. Change the frame size of the tree with the cursor.
- Tick the Shadow box to add a shadow to all the boxes on the tree chart. Turn the rotary tool to indicate the axis of the shadow and specify its opacity by typing directly into the input field or by using the arrows to increase or decrease it. Change the width of the shadow with the cursor.
- Tick the Silhouette for Missing Media box for all boxes of the tree chart to have an image. Heredis draws the silhouette of a man or a woman for the persons to whom you have no assigned image.
Change the tree chart boxes
All boxes of a tree chart may be modified individually or overall.

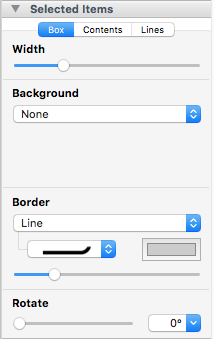
- Select the boxes to be changed and unfold the Selected Items panel.
- Click the Box tab.
- Change the width of the boxes selected with the cursor. If the boxes are not of a fixed size, the change will be proportional to the initial size of each box.
- Choose the type of background: None, Color Fill, Gradient Fill or Picture. The tools vary depending on the type selected.
-
- None: the text appears directly on the tree chart box and the box is transparent.
- Color Fill: click the color box to choose a color.
- Gradient Fill: click in each of the color fields to choose the start and finish colors. Click the arrows to reverse the gradient in the box. Turn the rotary tool to indicate the gradient axis.
- Picture: click the Modify button (
 ) to select a new background image for the box.

5. Choose the type of border for the box: None, Line or Frame. Specify the appearance of the border according to the type selected.
-
- None: the box is not bordered.
- Line: select a form of border (straight or rounded corners). Click the color box to choose a hue in the color panel. Use the slider to set the width of the border.
- Frame: click the Modify button () to select a new frame image for the box. Use the slider to set the width of the frame.
Info • You may only apply borders to drawn boxes. The background images of the box must contain a border in the image.
6. Indicate whether the selected boxes should be turned. To change the axis of the selected boxes, use the cursor or select a value from the pop-up menu.
All changes are immediately displayed on the tree chart.
Modify the content
Click on the Modify button (![]() ) on the Contents tab to apply to the selected boxes. Choose the content you want to apply to the selected boxes.
) on the Contents tab to apply to the selected boxes. Choose the content you want to apply to the selected boxes.

Click OK, the new content is applied on the selected boxes.
Info • For each box on the tree chart, you can see the information displayed. Unfold the Data panel to check them.
Modify connecting lines

- Click the Lines tab.
- Choose the type of line to connect the selected boxes from the pop-up menu: right angles, rounded corners or curves.
- Select a line style from the pop-up menu.
- Specify the width of the connecting line with the cursor and click the color box to choose a color.
All changes are immediately displayed on the tree chart.
Edit the text of a box
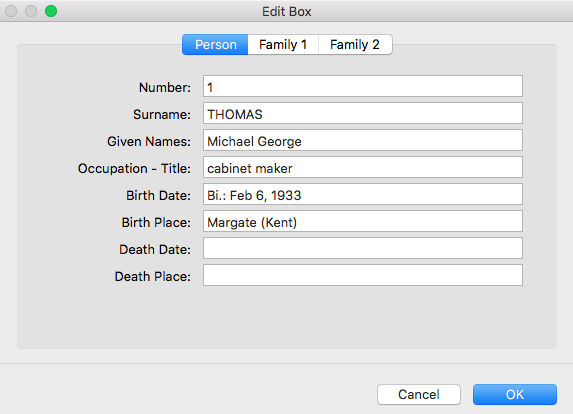
- Double-click the box to be edited to open the editing field.
Info • You can only edit one box at a time. - Enter changes to the displayed text.
- Click OK to apply changes.
Changes made in a tree chart file won’t be apply to the Heredis file.
You can also consult our articles (Mac) Print a tree chart, (Mac) Save a tree chart, and (Mac) Export a tree chart.
